What 3,545 TennisIA analyses show: the weakest phases of the forehand, backhand and serve
The app's aggregated data from November 2025 to November 2026: the average rating of each phase of the stroke, the body measurements that most often fall outside the ideal range, why videos get rejected and how many players are left-handed.
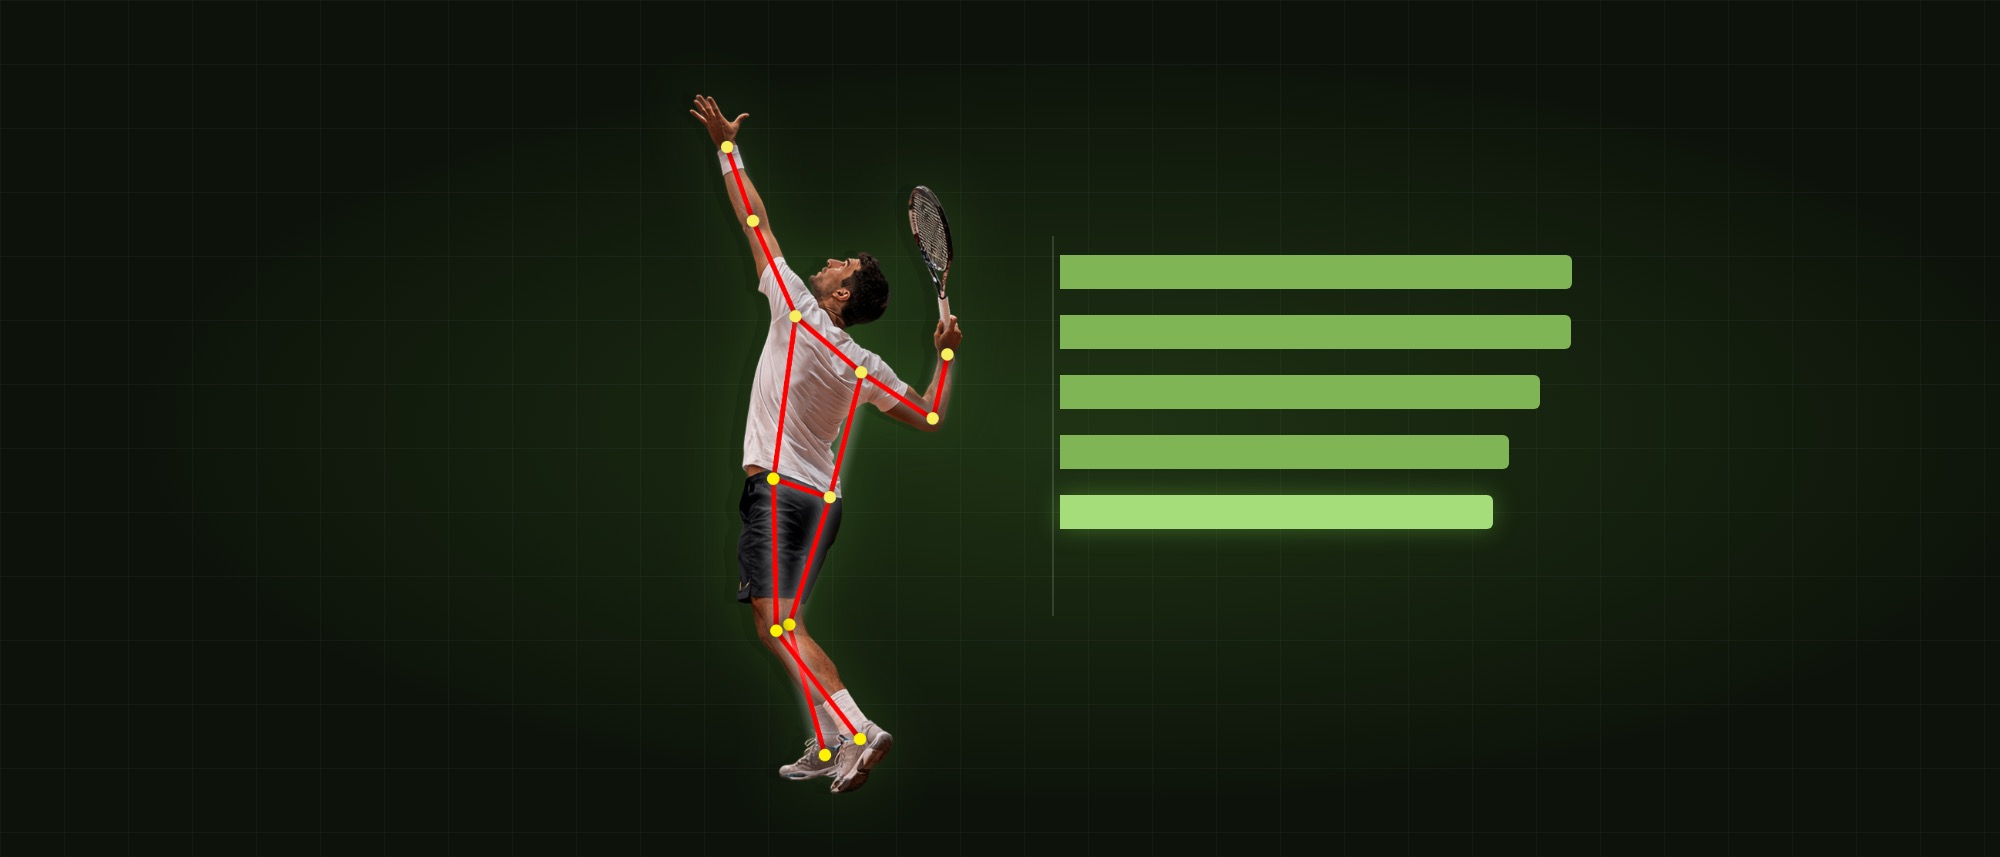
TennisIA analyzes the forehand, backhand and serve videos that players upload: it rates each phase of the stroke from 1 to 10 and, when the video is filmed from the side, measures the body's angles, rotations and timing. Taken together, thousands of analyses show in which phases the players who use the app get the lowest ratings.
This report collects the aggregated data of 3,545 rated analyses, from November 2025 to November 2026: only counts and averages, no personal data. These numbers can't be found anywhere else, and we publish them together with the method, so it's clear what they say and what they don't.
Where the data comes from
The numbers come from the analyses made with the app from November 26, 2025 to November 5, 2026, excluding test accounts.
In total there are 4,147 analyses: 3,545 rated (1,613 forehands, 1,424 serves and 508 backhands; the forehands alone come from 1,086 different players), 497 rejected because the video didn't allow the movement to be measured and 105 stopped by a technical problem.
The phase ratings are the ones the app's analysis gives each stroke, from 1 to 10. Body measurements exist only for videos filmed from the side: 634 forehands, 719 serves and 185 backhands. Every average is based on at least 30 analyses; over time the analysis has named some phases in slightly different ways, and here we keep the main names, each with hundreds of analyses.
The sample is the players who use TennisIA, not all tennis players: the numbers describe them, and should be read that way.
The phases of the stroke: where ratings are lowest
In the forehand and the backhand the phase with the lowest average rating is the loading, the moment when legs and trunk load up before moving toward the ball; the one with the highest rating is the preparation.
In the forehand the loading averages 6.2 out of 10 (across 1,425 analyses), against 7.3 for the preparation and the follow-through; contact also lags behind, at 6.4. In the backhand the order is the same, with higher ratings: loading 6.8, preparation 7.6.
In the serve the weakest phase is the swing and acceleration, at 5.7 (across 900 analyses); next come the loading and the ball toss, both around 6.4, while the starting stance is the strongest, at 7.2. In all three strokes the lowest ratings go to the phases where the body has to load up or accelerate.
The body measurements that most often miss the ideal
For each measurement the app has an ideal range. The chart shows in how many strokes the measurement falls within it: the shorter the bar, the more often players fall outside. We show a selection: the measurements with the most direct meaning for players.
Among the measurements shown, in the forehand the weakest concern rotation: the separation between hips and shoulders is within the ideal range in only 16% of strokes, shoulder rotation and trunk rotation speed in 17%. On average the shoulders turn 88°, below the minimum of the ideal range (90°). Head stability (70%) and the sequence that starts from the legs and reaches the arm (75%) do better.
In the serve, again among those shown, the one most often outside is the arm lag before contact: it is within the ideal range in only 8% of serves, with an average of 34° against a minimum of 60°. The height of the ball toss (11%) and the leg bend in the loading (32%) also rarely fall within it: the knee angle averages 136°, while the ideal range stops at 130°, so the legs bend less than they should. The tossing arm, on the other hand, is extended as it should be in 84% of serves.
In the backhand, on a smaller sample (185 analyses), among the measurements shown hip rotation (18% within the ideal range) and shoulder rotation (21%) fall outside most often.
Why a video gets rejected
12% of uploaded videos (497 out of 4,147) can't be analyzed. In those cases the app explains the reason and how to redo the video, and the analysis is refunded.
The reason is recorded only for the most recent rejections, 126. Among these the most common is the player being too far from the camera (41%), then filming from the front (25%), a moving camera (14%), the player hard to see (13%) and filming from behind (7%). Another 2.5% of analyses (105) stopped because of a technical problem unrelated to the video.
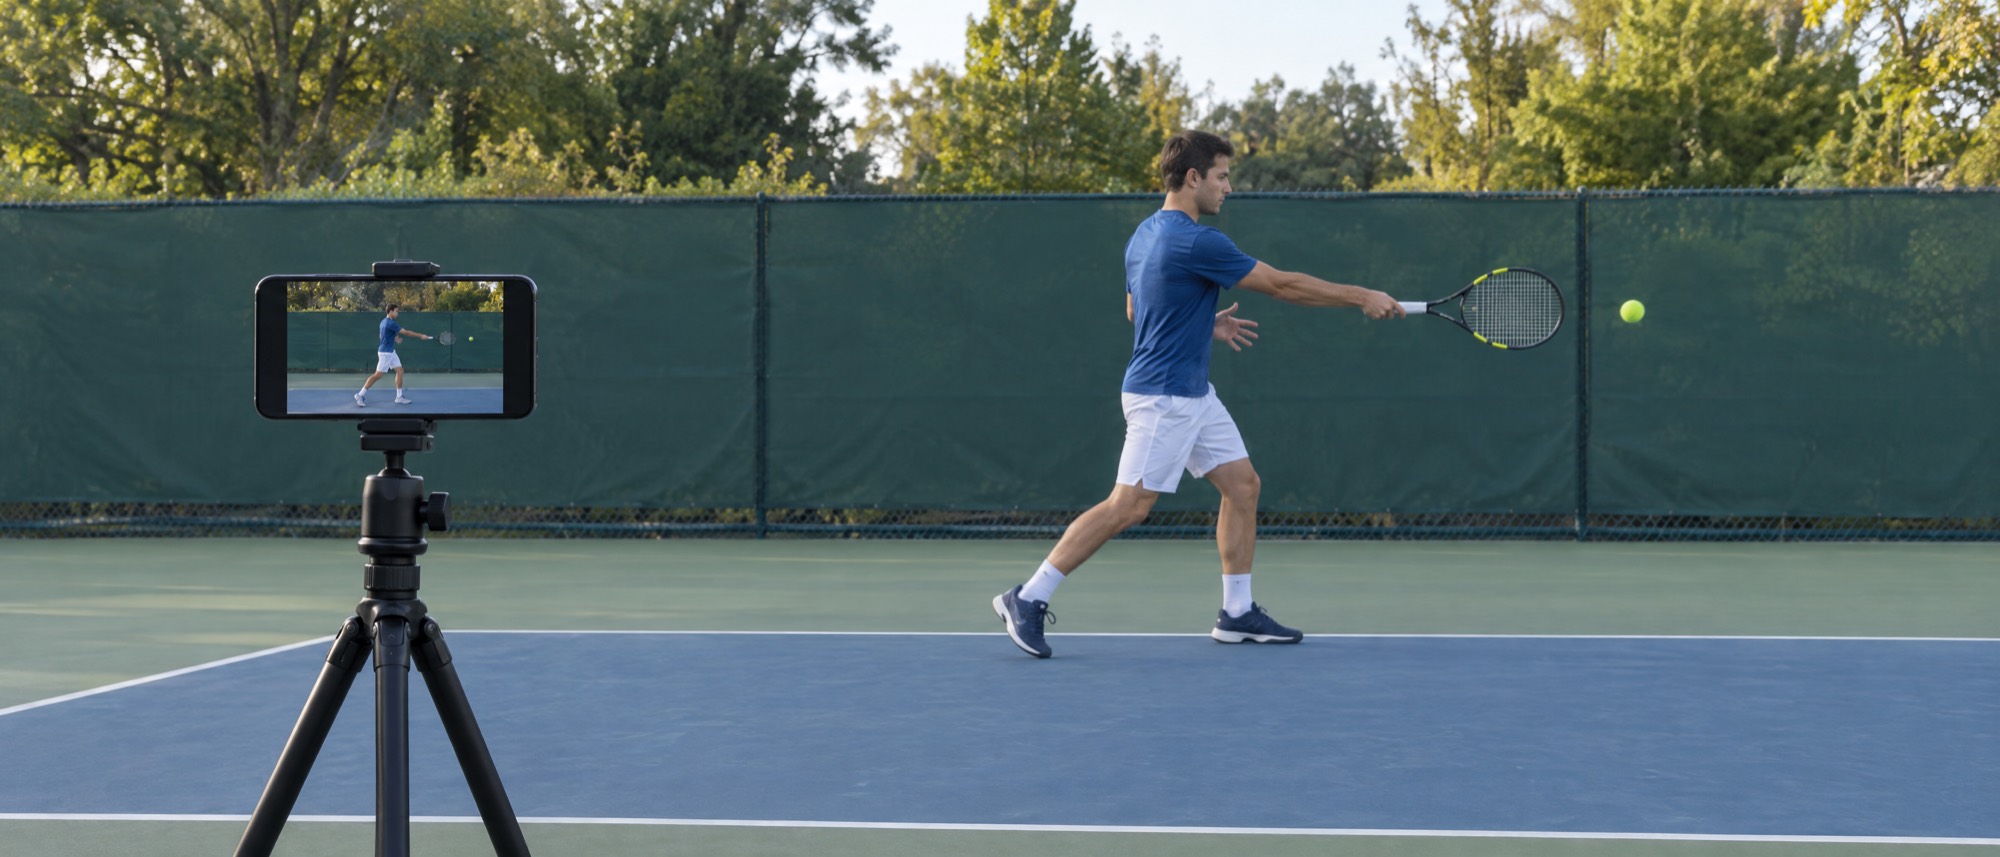
The most common reasons among those recorded can be avoided with the rules in the guide on how to film your strokes: phone to the side, 3-5 meters away, steady, with the whole player in frame.


What to do with it in practice
The data shows where to look first, not what you get wrong: every player is different, and the quickest way to find out is to analyze your own stroke.
If you're working on your forehand or backhand, the loading is a good place to start: trunk rotation, bent legs and weight ready to push toward the ball. If you're working on your serve, the phase to focus on is the acceleration, with the arm staying back while the body rotates and the legs really bending before the push.
And if you're left-handed, you're in good company: left-handers make up 13% of biomechanical analyses (201 out of 1,538), and the analysis works out by itself which hand you play with.
The numbers change as analyses grow, and this report shows the date of the latest update. To find out how your stroke is doing, rather than the average one, download TennisIA and analyze your forehand, backhand or serve: in about 2 minutes you get a rating for each phase and, with a video filmed from the side, the biomechanical score.
FAQ
What is the hardest phase of the forehand?+
In TennisIA's analyses the phase with the lowest average rating is the loading: 6.2 out of 10, across 1,425 forehands analyzed from November 2025 to November 2026, against 7.3 for the preparation. Contact comes right after (6.4).
What is the hardest phase of the serve?+
In TennisIA's analyses the phase with the lowest average rating is the swing and acceleration: 5.7 out of 10 across 900 serves. Among body measurements, the arm lag before contact is within the ideal range in only 8% of serves.
How many tennis videos get rejected by the analysis, and why?+
12% (497 out of 4,147). Among rejections with a recorded reason, the most common are the player being too far from the camera (41%) and filming from the front (25%). The app explains how to redo the video and refunds the analysis.
Where does this data come from?+
From the analyses made with the TennisIA app from November 26, 2025 to November 5, 2026, excluding test accounts: 4,147 analyses, of which 3,545 rated. We only publish aggregated data, counts and averages, never personal data, and every average is based on at least 30 analyses.
How many measurements does the biomechanical analysis take?+
It depends on the stroke: up to 30 in the forehand. Measurements exist only for videos filmed from the side, which show the body's profile.
How many tennis players are left-handed?+
Among TennisIA's biomechanical analyses, 13% (201 out of 1,538) are of a left-handed player. That's the figure for players who use the app, not for all tennis players.
One technique guide a week, straight to your inbox.
No spam, just analysis and data.